Trig Graph Transformations
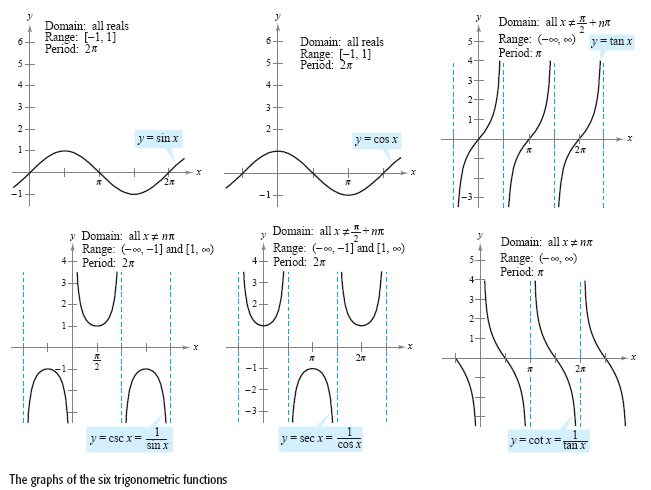
Here are the 6 Basic Trig Functino Graphs:

Here are the Transformations:
The basic trig functions are:
-
y=sinx
-
y=cosx
-
y=tanx
-
y=cscx
-
y=secx
-
y=cotx
These graphs can be altered with a variety of transformations. Most trig functions take the form of y=asin(bx+c)+d. Sine can be replaced with any of the other five trig functions.
When a, b, c, and d are changed the graph is changed. These changes are described below.
Transformations:
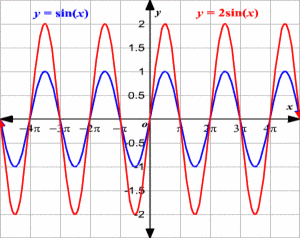
A: a is the variable for vertical stretch. For sinusoidal graphs the value of a is equal to the amplitude. For a basic sine or cosine
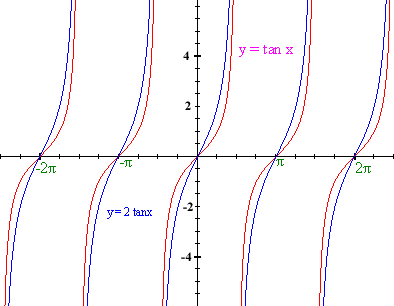
graph, the value of a is equal to 1. This means the amplitude of these graphs is 1 as well. Things are a little different for tangent. Since there is no amplitude, the vertical stretch affects the graph differently. In a normal tangent graph there is a point at (π/4,1). This point is halfway between the intersection with the x-axis and the vertical asymptote. When the a value changes, the x value of this point stays constant while the y value changes. This value increases with an increase in a. For example, if y=2tan(x), the point would be at (π/4, 2). Additionally, when the value of a is negative, a vertical flip occurs. This can be seen in the examples below.
B: b is the variable for horizontal stretch. In order to graph the function correctly, it is best to make sure the equation is in
y=asinb(x+c/b)+d form rather than y=asin(bx+c)+d form. When the x is alone like this the horizontal stretch is easier to deal with. Once the x is by itself you can work with the b coefficient. The period divided by the value of b is equal to the new period. This can be used to accurately graph the function. Another way to look at is that b is equal to the number of cycles that fit in one normal period. This is shown in the examples below.
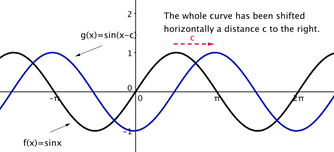
C: c is the variable for horizontal shift. The best way to properly interpret horizontal shift is to get the equation
into y=asinb(x+c/b)+d as opposed to y=asin(bx+c)+d form. The c/b part of that eqation is the magnitude of the shift. If the quantity is positive, the shift is to the left. If the quantity is negative, the shift is to the right. This can be seen in the pictures below.
D: d is the variable for vertical shift. If d is positive, its magnitude is the number of units the graph is translated up. If d is
negative, its magnitude is the number of units the graph is translated down. This is shown below.
 |  |
|---|---|
 |
 |  |
|---|---|
 |  |
 |  |
 |  |
|---|---|
 |
 |  |
|---|
Caption:
This entry gave a good overview of trig graph transformations. I think this is extremely important because a lot of these rules hold true for other graphs. Because of this, it is paramount to gain a good understanding of the concepts behind the graphs. Not only is graphing a skill you need to know, but knowing the graphs makes it easier to complete word problems and understand the values for trig functions at various angles. I split each type of transformation into its own section because I felt that this was the best way to make it easier to understand the concepts. Additionally, I included many examples so that there would be minimal confusion.


